Tables
Tables are the primary output format. A Table is a 2-D grid of styled cells that can be exported to HTML, Excel, a pandas DataFrame, or displayed inline in Jupyter.
The model.tables namespace
All table methods live on model.tables.
line_items() — full model table
# All line items, names as row labels
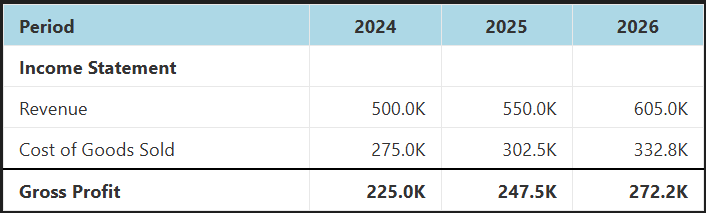
model.tables.line_items().show()
# Specific items only
model.tables.line_items(line_items=["revenue", "gross_profit", "net_income"]).show()
# Show label instead of name
model.tables.line_items(include_name=False, include_label=True).show()
# Without the auto-generated Total row
model.tables.line_items(include_total_row=False).show()
line_item() — single item with optional analysis rows
model.tables.line_item("revenue").show()

# Period-over-period % change
model.tables.line_item("revenue", include_percent_change=True).show()

# Cumulative change from base period
model.tables.line_item("revenue", include_cumulative_change=True).show()

# Cumulative % change from base period
model.tables.line_item("revenue", include_cumulative_percent_change=True).show()

# All analysis rows together
model.tables.line_item(
    "revenue",
    include_percent_change=True,
    include_cumulative_change=True,
    include_cumulative_percent_change=True,
).show()
precedents() — formula dependency view
Shows what feeds into a FormulaLine. Precedent items appear above a border; the calculated item is shown in bold below it. Useful for auditing formulas.
For non-formula items (like FixedLine), only the item itself is shown in bold.
Convenience shortcut from LineItemResult
model["revenue"].table(include_percent_change=True).show()
# equivalent to model.tables.line_item("revenue", include_percent_change=True)
Custom tables with from_template()
Build any table layout by passing a list of row type instances to from_template(). This is the most flexible approach.
from pyproforma.tables import HeaderRow, LabelRow, ItemRow, BlankRow, LineItemsTotalRow

table = model.tables.from_template([
    HeaderRow(),
    LabelRow(label="Revenue"),
    ItemRow(name="product_revenue"),
    ItemRow(name="service_revenue", bottom_border="single"),
    LineItemsTotalRow(
        line_item_names=["product_revenue", "service_revenue"],
        label="Total Revenue",
        bold=True,
    ),
    BlankRow(),
    LabelRow(label="Expenses"),
    ItemRow(name="cogs"),
    ItemRow(name="operating_expenses", bottom_border="single"),
    LineItemsTotalRow(
        line_item_names=["cogs", "operating_expenses"],
        label="Total Expenses",
        bold=True,
    ),
])
table.show()
Row configs can also be passed as plain dicts with a "row_type" key if you prefer:
template = [
    {"row_type": "header"},
    {"row_type": "label", "label": "Income Statement"},
    {"row_type": "item", "name": "revenue"},
    {"row_type": "blank"},
]
model.tables.from_template(template).show()
Row types reference
| Row type | Key parameters | Description |
|---|---|---|
HeaderRow(col_labels) |
col_labels |
Column headers. Defaults to "Label". |
ItemRow(name, ...) |
name, label, bold, top_border, bottom_border, hardcoded_color |
Single line item row. |
LabelRow(label, bold) |
label, bold |
Section header spanning all columns. |
BlankRow() |
— | Empty row for visual spacing. |
PercentChangeRow(name) |
name |
Period-over-period % change. |
CumulativeChangeRow(name) |
name |
Change from base period, in original units. |
CumulativePercentChangeRow(name) |
name |
% change from base period. |
LineItemsTotalRow(line_item_names, label, ...) |
line_item_names, label, bold, top_border, bottom_border |
Sum of named items. |
TagTotalRow(tag, label) |
tag, label |
Sum of all items with a given tag. |
ItemRow options
ItemRow(
    name="revenue",
    label="Custom Label",        # overrides the line item's label
    bold=True,
    top_border="single",         # or "double"
    bottom_border="single",
    hardcoded_color="steelblue", # highlights fixed-value periods in that color
)
hardcoded_color is useful for distinguishing input cells from calculated cells in auditing workflows.
Tag-based rows
TagTotalRow sums all line items with the given tag — the list is resolved at render time from the model, so the table stays correct if you add or remove tagged items.
from pyproforma.tables import TagTotalRow

model.tables.from_template([
    HeaderRow(),
    ItemRow(name="product_revenue"),
    ItemRow(name="service_revenue", bottom_border="single"),
    TagTotalRow(tag="revenue", label="Total Revenue", bold=True),
])
Exporting a table
Every Table object supports the same set of export methods:
table = model.tables.line_items()

table.show()                      # display inline in Jupyter (renders as HTML)
table.to_html()                   # returns HTML string (inline CSS styling)
table.to_bootstrap_html()         # returns HTML string (Bootstrap CSS classes)
table.to_excel("output.xlsx")     # write to Excel with formatting preserved
table.to_dataframe()              # pandas DataFrame with string-formatted values
table.to_styled_dataframe()       # pandas Styler object
table.to_json()                   # JSON string
Excel export
Formatting (bold, borders, background colours, number formats) is fully preserved in the Excel output via openpyxl.
HTML export
to_html() produces self-contained HTML with inline CSS — safe to embed in any page without a stylesheet.
to_bootstrap_html() produces HTML that relies on Bootstrap classes — used by the Flask explorer app.